

In the physical world, logistics advances created opportunities for companies to upend old business models. Both Wal-Mart (Cross-Docking) and Dell (Just-In-Time Manufacturing) leveraged superior logistics to create outsized competitive advantages by fundamentally re-defining how goods are moved from the factory to the consumer.
In the world of software, advances in DevOps (Developer Operations) from companies like Nitrous.IO, Docker, CoreOS and others are laying the foundation for next wave of businesses to gain an outsized advantage by fundamentally accelerating the way Software is delivered from the developer’s workspace (“factory”) to the “production servers” where it consumed by the end-user.
This blog post leverages opensource technologies to show a practical example how the current advances in DevOps allow the rapid creation of complex services.
The Goal
Create a scalable MVP clone of the popular SaaS and Mobile analytics service: MixPanel
Ingredients
We will use three Open Source components and a little javascript to accomplish this :
- InfluxDB - A popular OpenSource Time Series Database written in Go to Store the Data
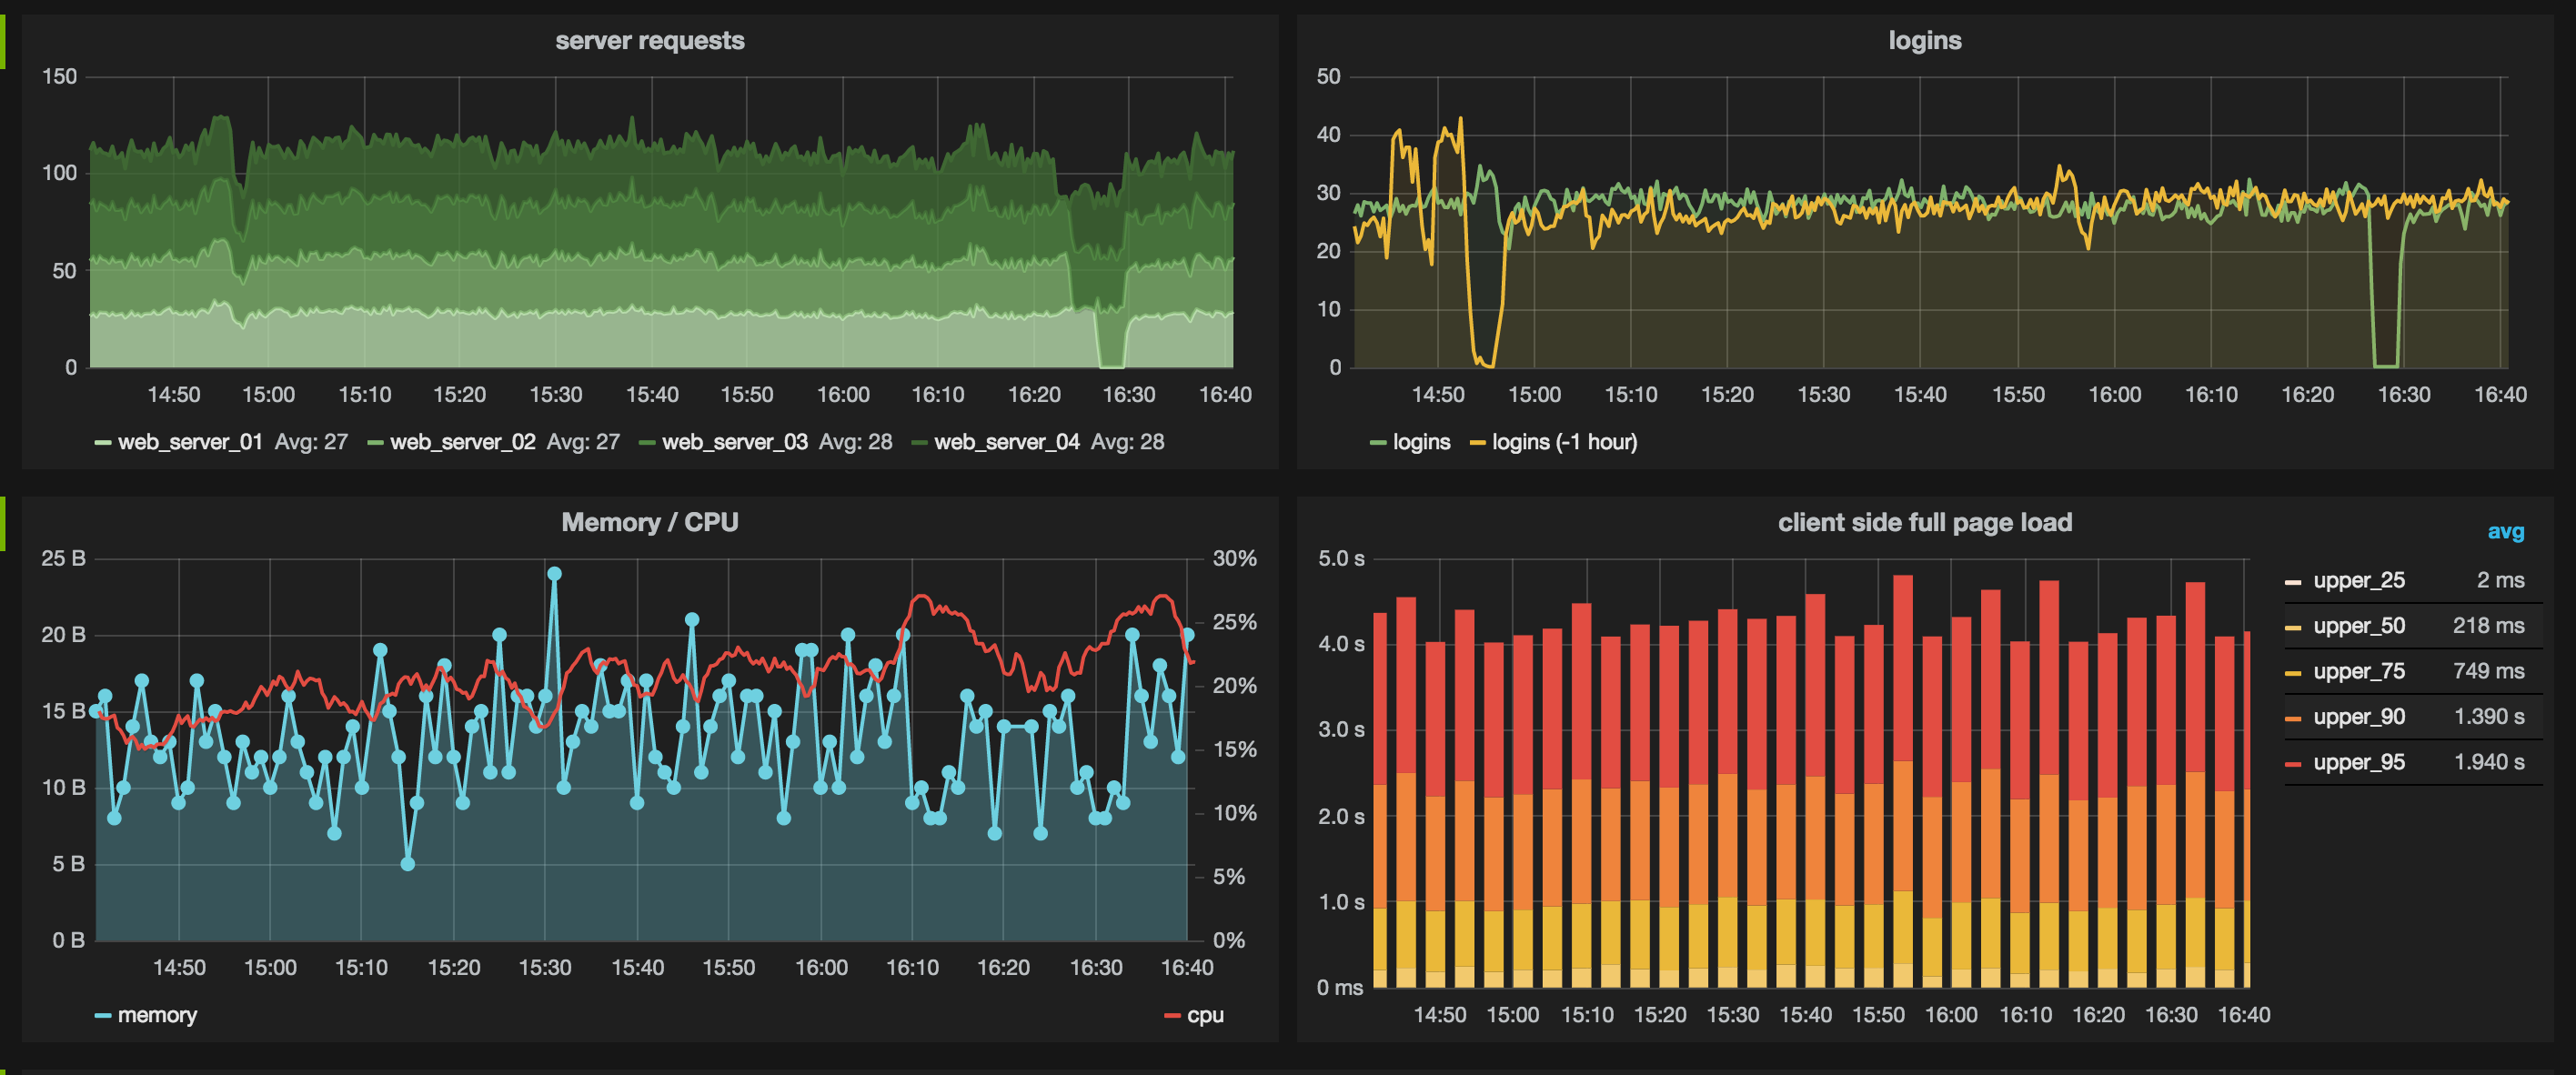
- Grafana - A Visualization Tool to View our Time Series Event Data
- Docker/Boot2Docker - Amazing Containerization technology which enables a new approach to DevOps
The Steps
1. Setup a Docker Host
Docker has rapidly become the de-facto technology for containerized services. You can install Docker or use Boot2Docker on your Mac, AWS’ Elastic Container Service, or bring up your own Docker host on Google Compute
![]()
I will be using Boot2Docker on a Mac.
2. Launch and Setup InfluxDB
InfluxDB is a distributed time series data store with a clean native http API that we can easily scale up through clustering.
Once you have your Docker Host setup - let’s bring up InfluxDB in a Docker container. We will be using an existing image from Docker hub and exposing a couple of ports for an Admin interface.
docker run -p 8086:8086 -p 8083:8083 -d crosbymichael/influxdbThe InfluxDB Admin page at http://yourboot2docker_host_ip:8083
Set the username/password (root/root) and create a database (mixevents)
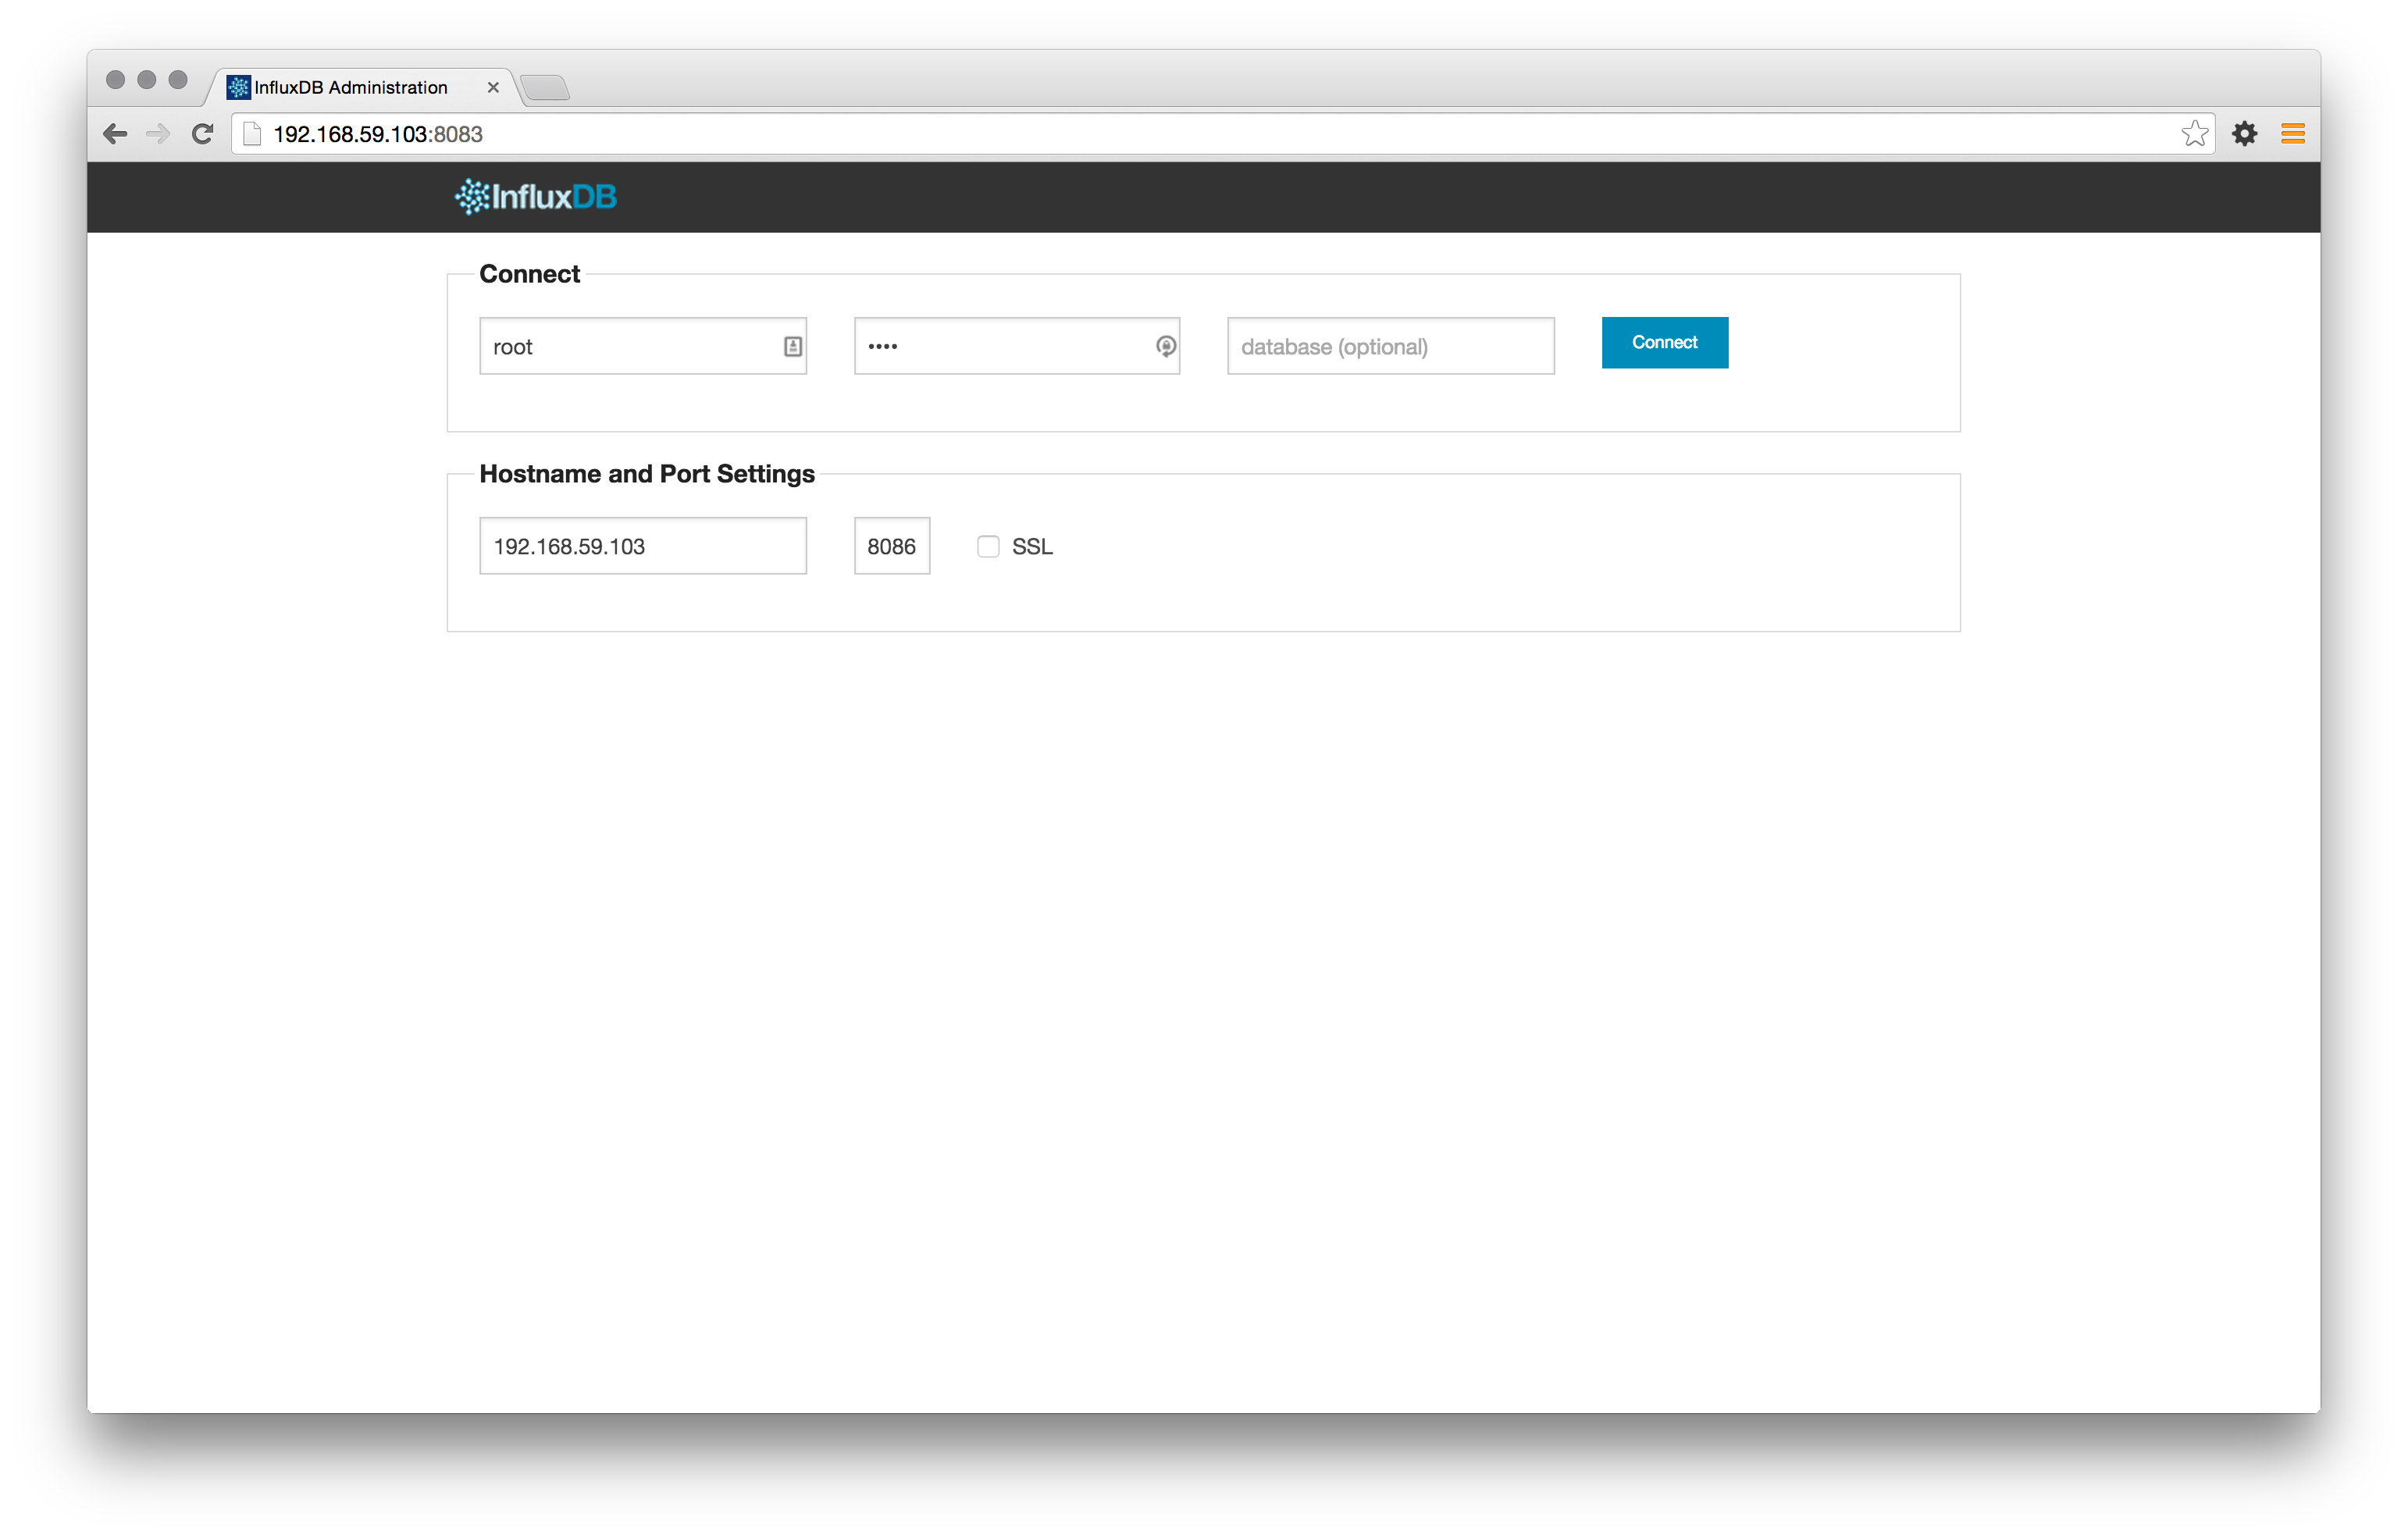
Note: 1) Find out the IP for your Boot2Docker Host with boot2docker ip 2) You should really persist the data outside the db container but that’s for another day.
3. Bring up Grafana
Grafana is a fantastic visualization tool that already suports querying InfluxDB.
We’ll bring grafana in seperate docker container using another image from Docker Hub and connect it to our InfluxDB container all in one step.
docker run -d -p 80:80 -e INFLUXDB_HOST=<DOCKER_HOST_IP> \
-e INFLUXDB_PORT=8086 -e INFLUXDB_NAME=mixevents -e INFLUXDB_USER=root \
-e INFLUXDB_PASS=root -e HTTP_USER=admin -e HTTP_PASS=mypass tutum/grafana \
-e INFLUXDB_IS_GRAFANADB=true
Head to your Docker Host’s IP on port 80 and login with admin/mypass for the basic authentication.
With two Docker commands most of our heavy lifting is done. Each component can now be updated and scaled inpedendently as needed. Now onto the configuration steps to add our data and visualizations.
4. Enter Data into InfluxDB
InfluxDB has clients for a variety of languages so you can easily send events from your Backend or directly from the Frontend.
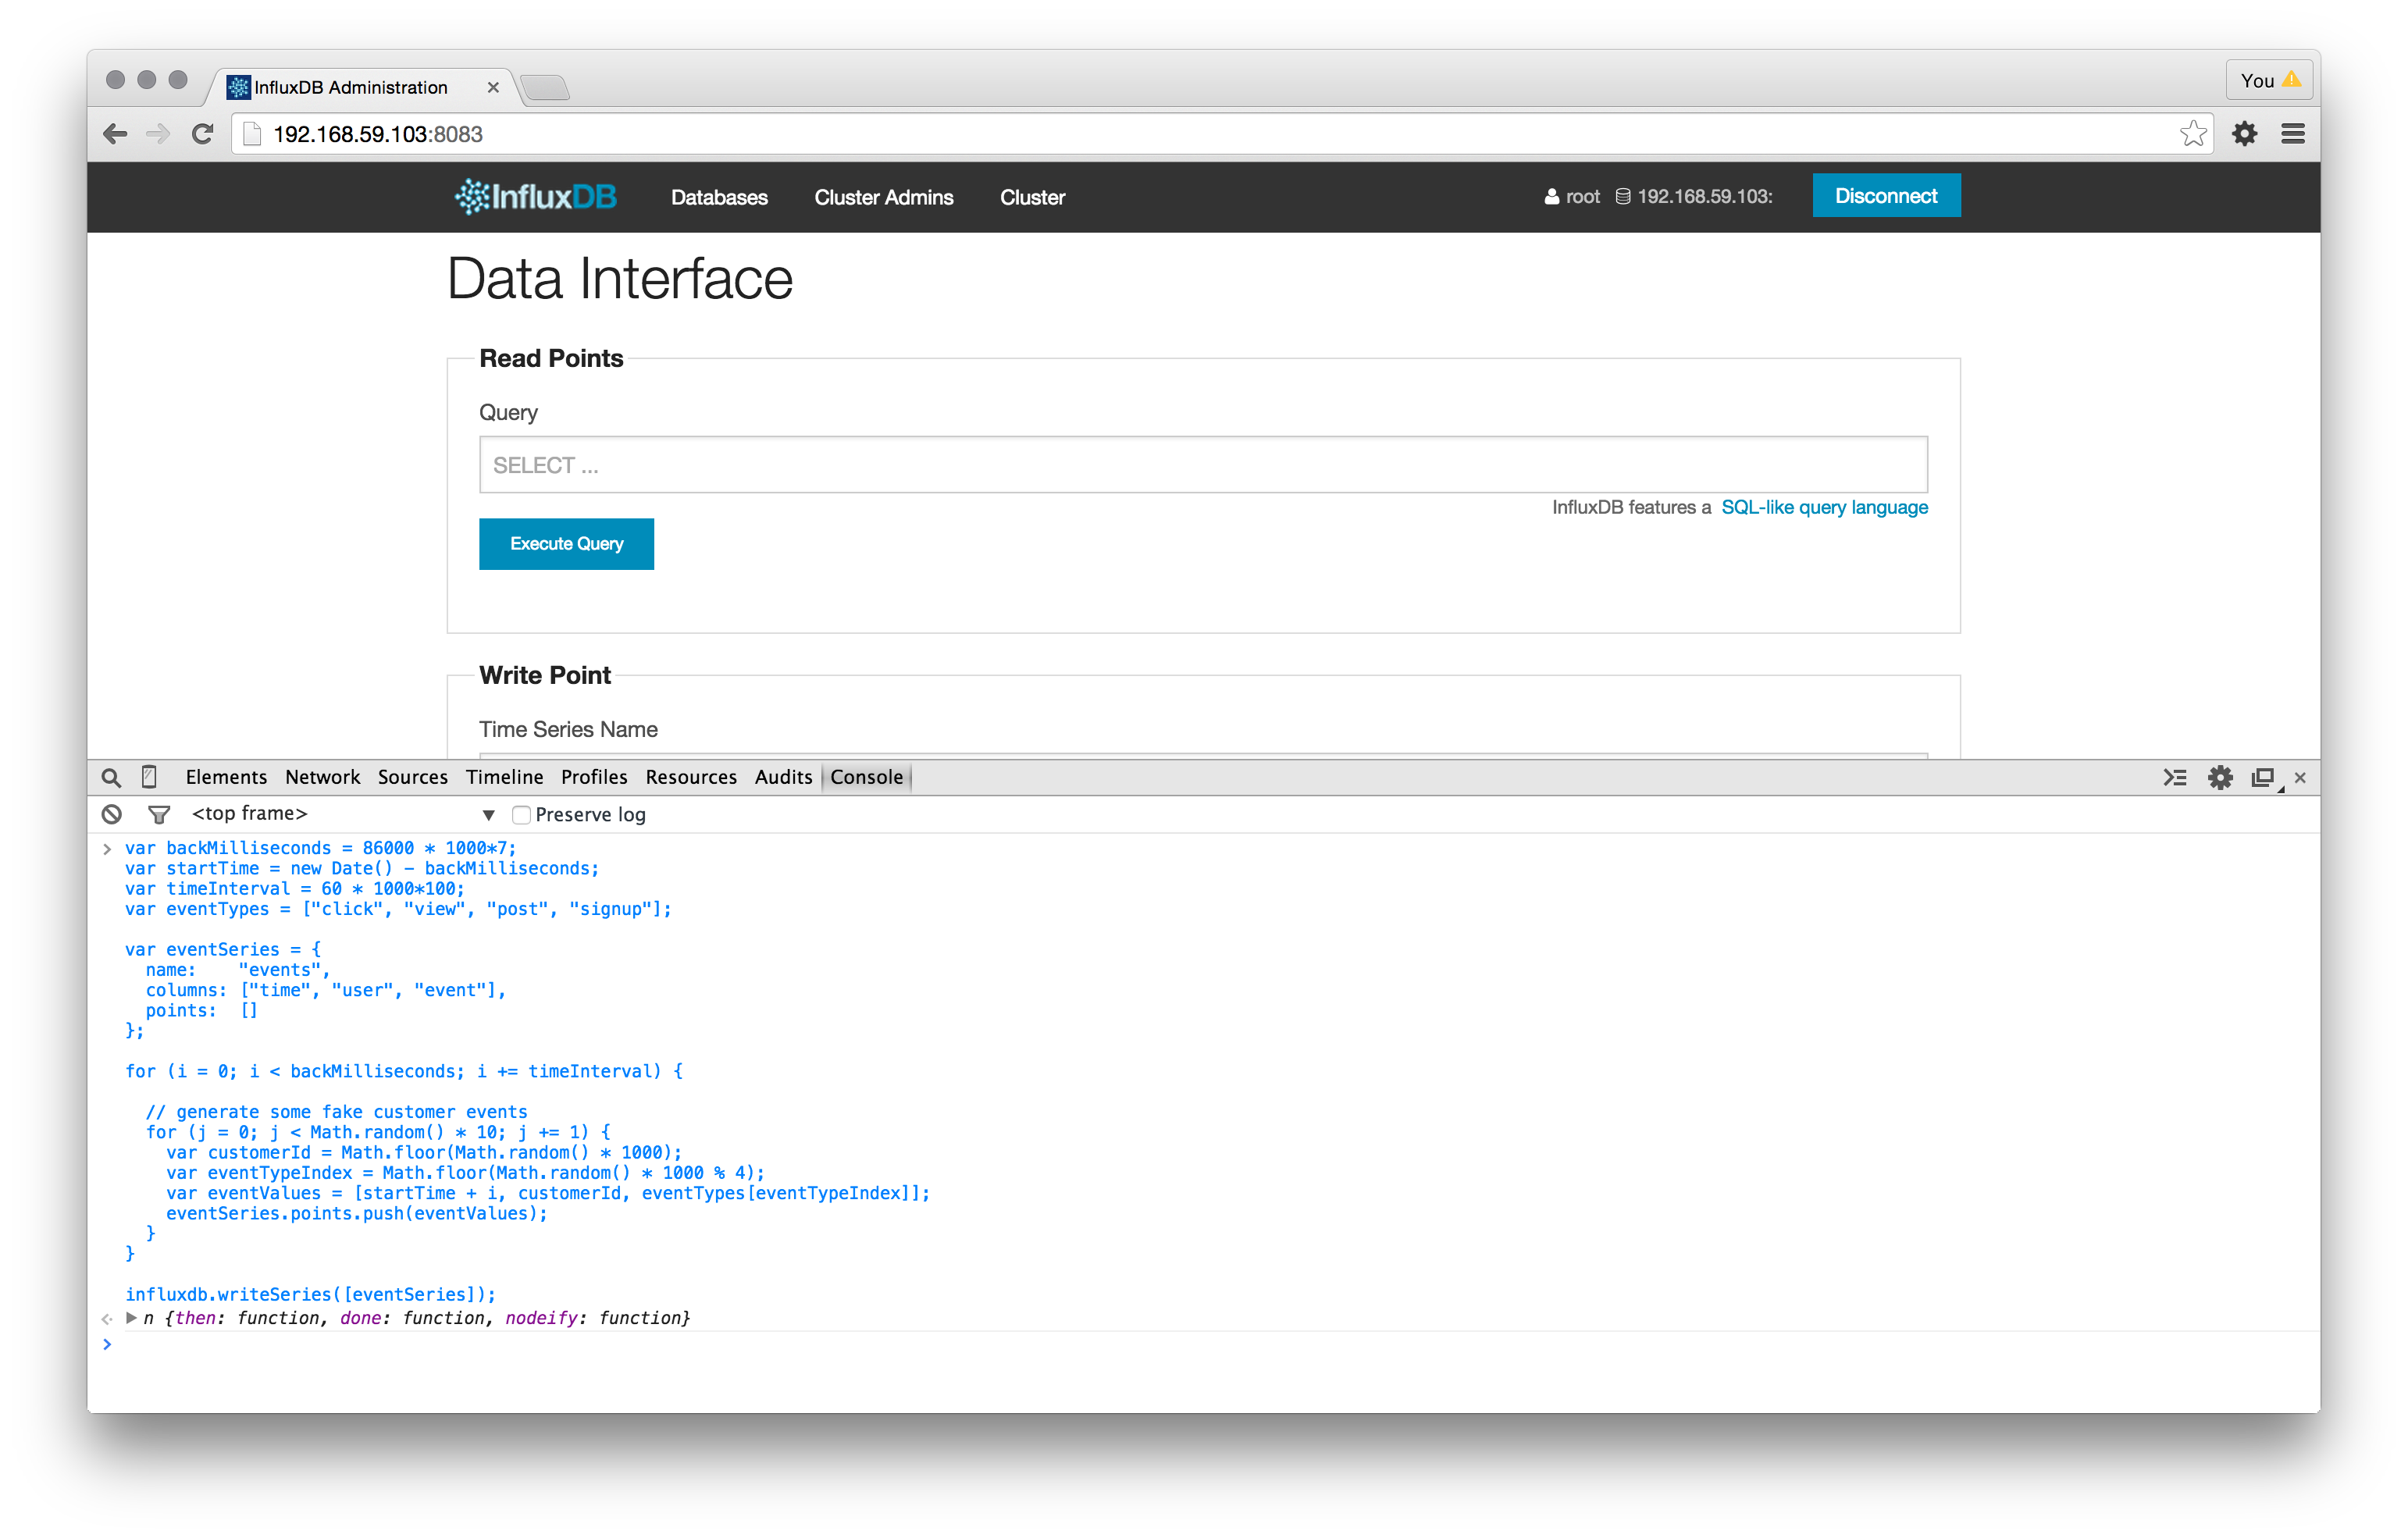
For this illustration, we will leverage the javascript library via the developer console on the InfluxDB Admin page to add some customer events.
//Adapted from http://influxdb.com/docs/v0.8/introduction/getting_started.html
// start time of 7 Days Ago
var backMilliseconds = 86000 * 1000*7;
var startTime = new Date() - backMilliseconds;
var timeInterval = 60 * 1000*100;
var eventTypes = ["click", "view", "post", "signup"];
var eventSeries = {
  name: "events",
  columns: ["time", "user", "event"],
  points: []
};

for (i = 0; i < backMilliseconds; i += timeInterval) {
 // generate some fake customer events
  for (j = 0; j < Math.random() * 10; j += 1) {
    var customerId = Math.floor(Math.random() * 1000);
    var eventTypeIndex = Math.floor(Math.random() * 1000 % 4);
    var eventValues = [startTime + i, customerId, eventTypes[eventTypeIndex]];
    eventSeries.points.push(eventValues);
  }
}

influxdb.writeSeries([eventSeries]);
5. Setup Grafana Dashboards
Grafana needs to be configured to show the data we want: Unique User Sign Ups over the last seven days.
From the Dashboard - Click on the “First Graph” Title to Edit the Graph
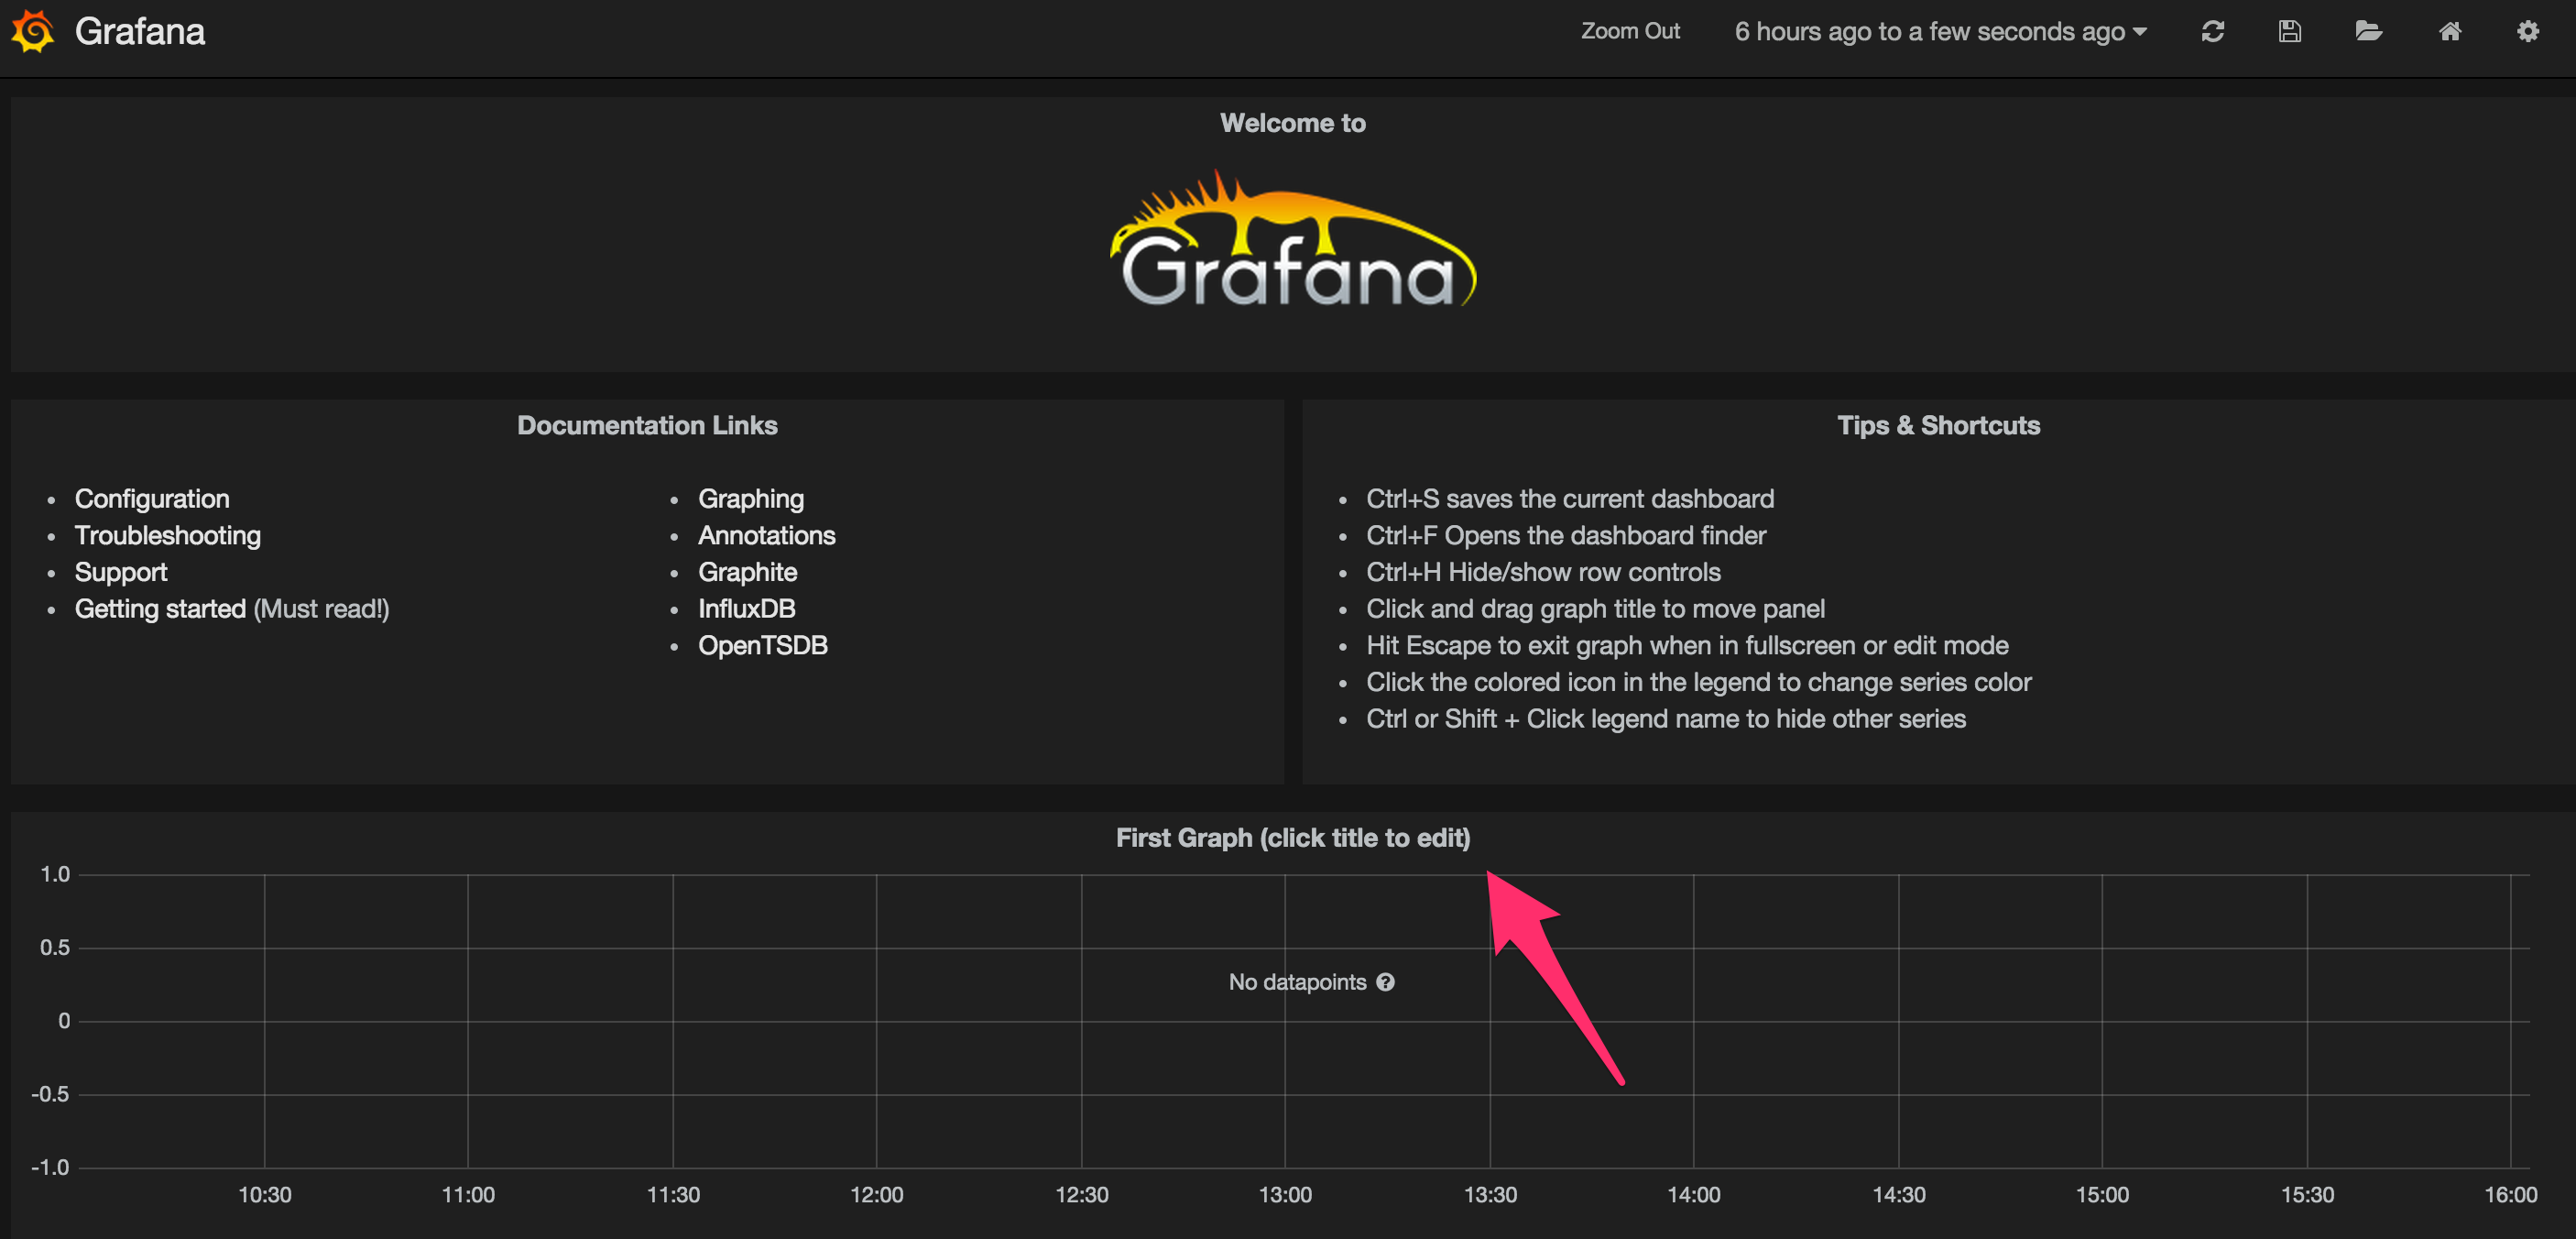
Click the Gear Icon and select “Raw Query Editor”
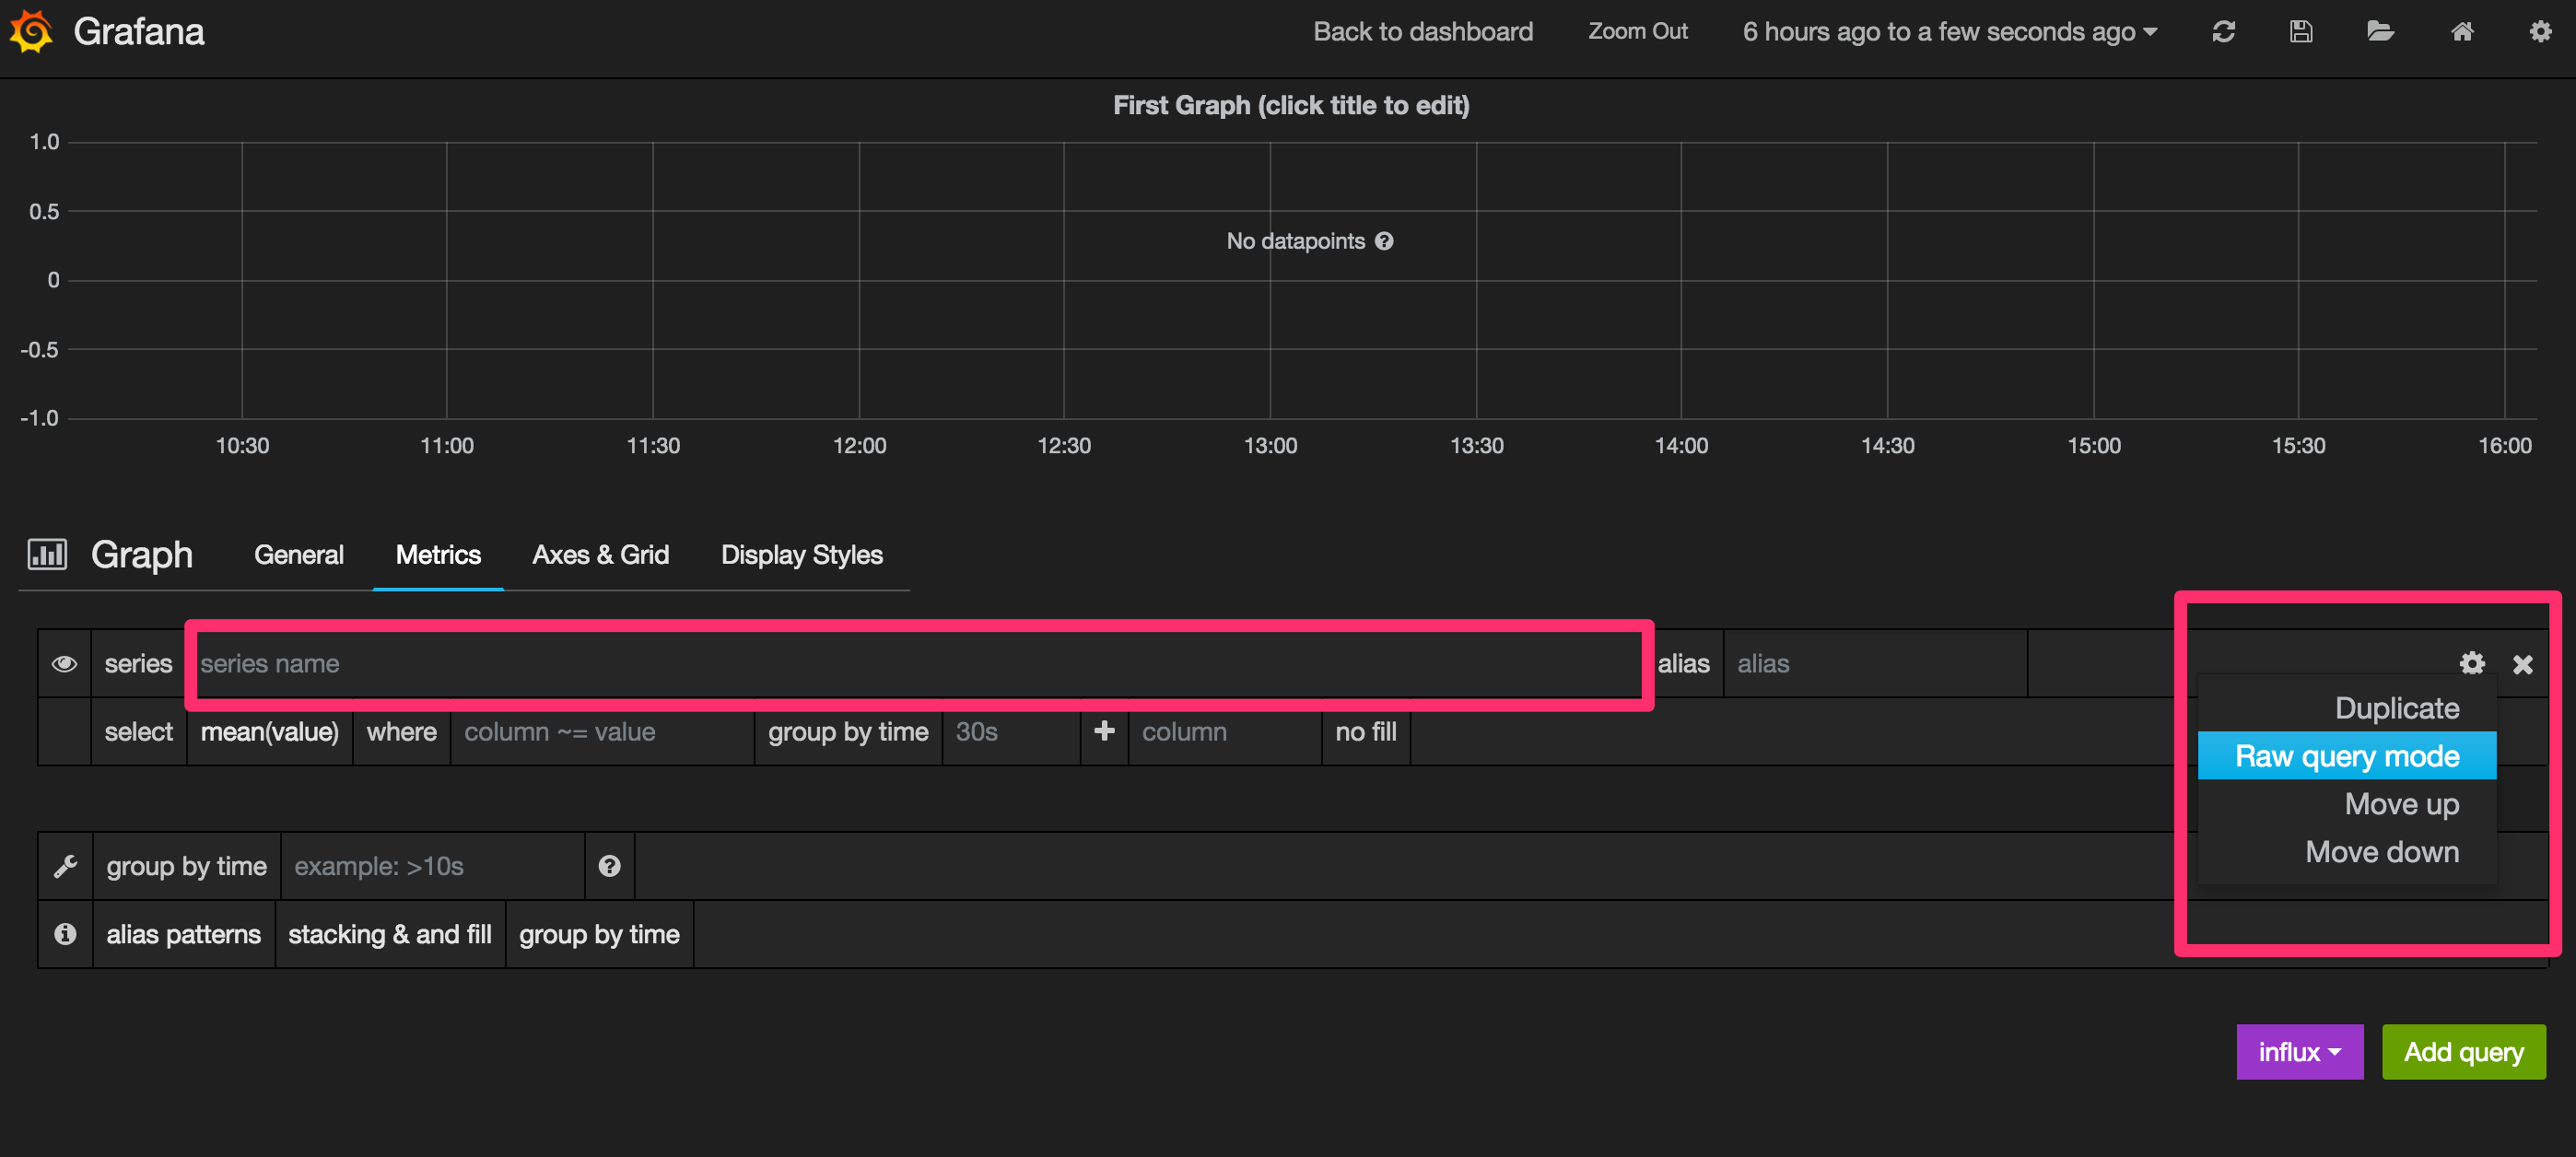
Using InfluxDB’s Query Syntax type the following query into the query field:
select count(distinct(user)) from "events" where $timeFilter \
and event =~/signup/i group by time($interval) order asc
Boom!
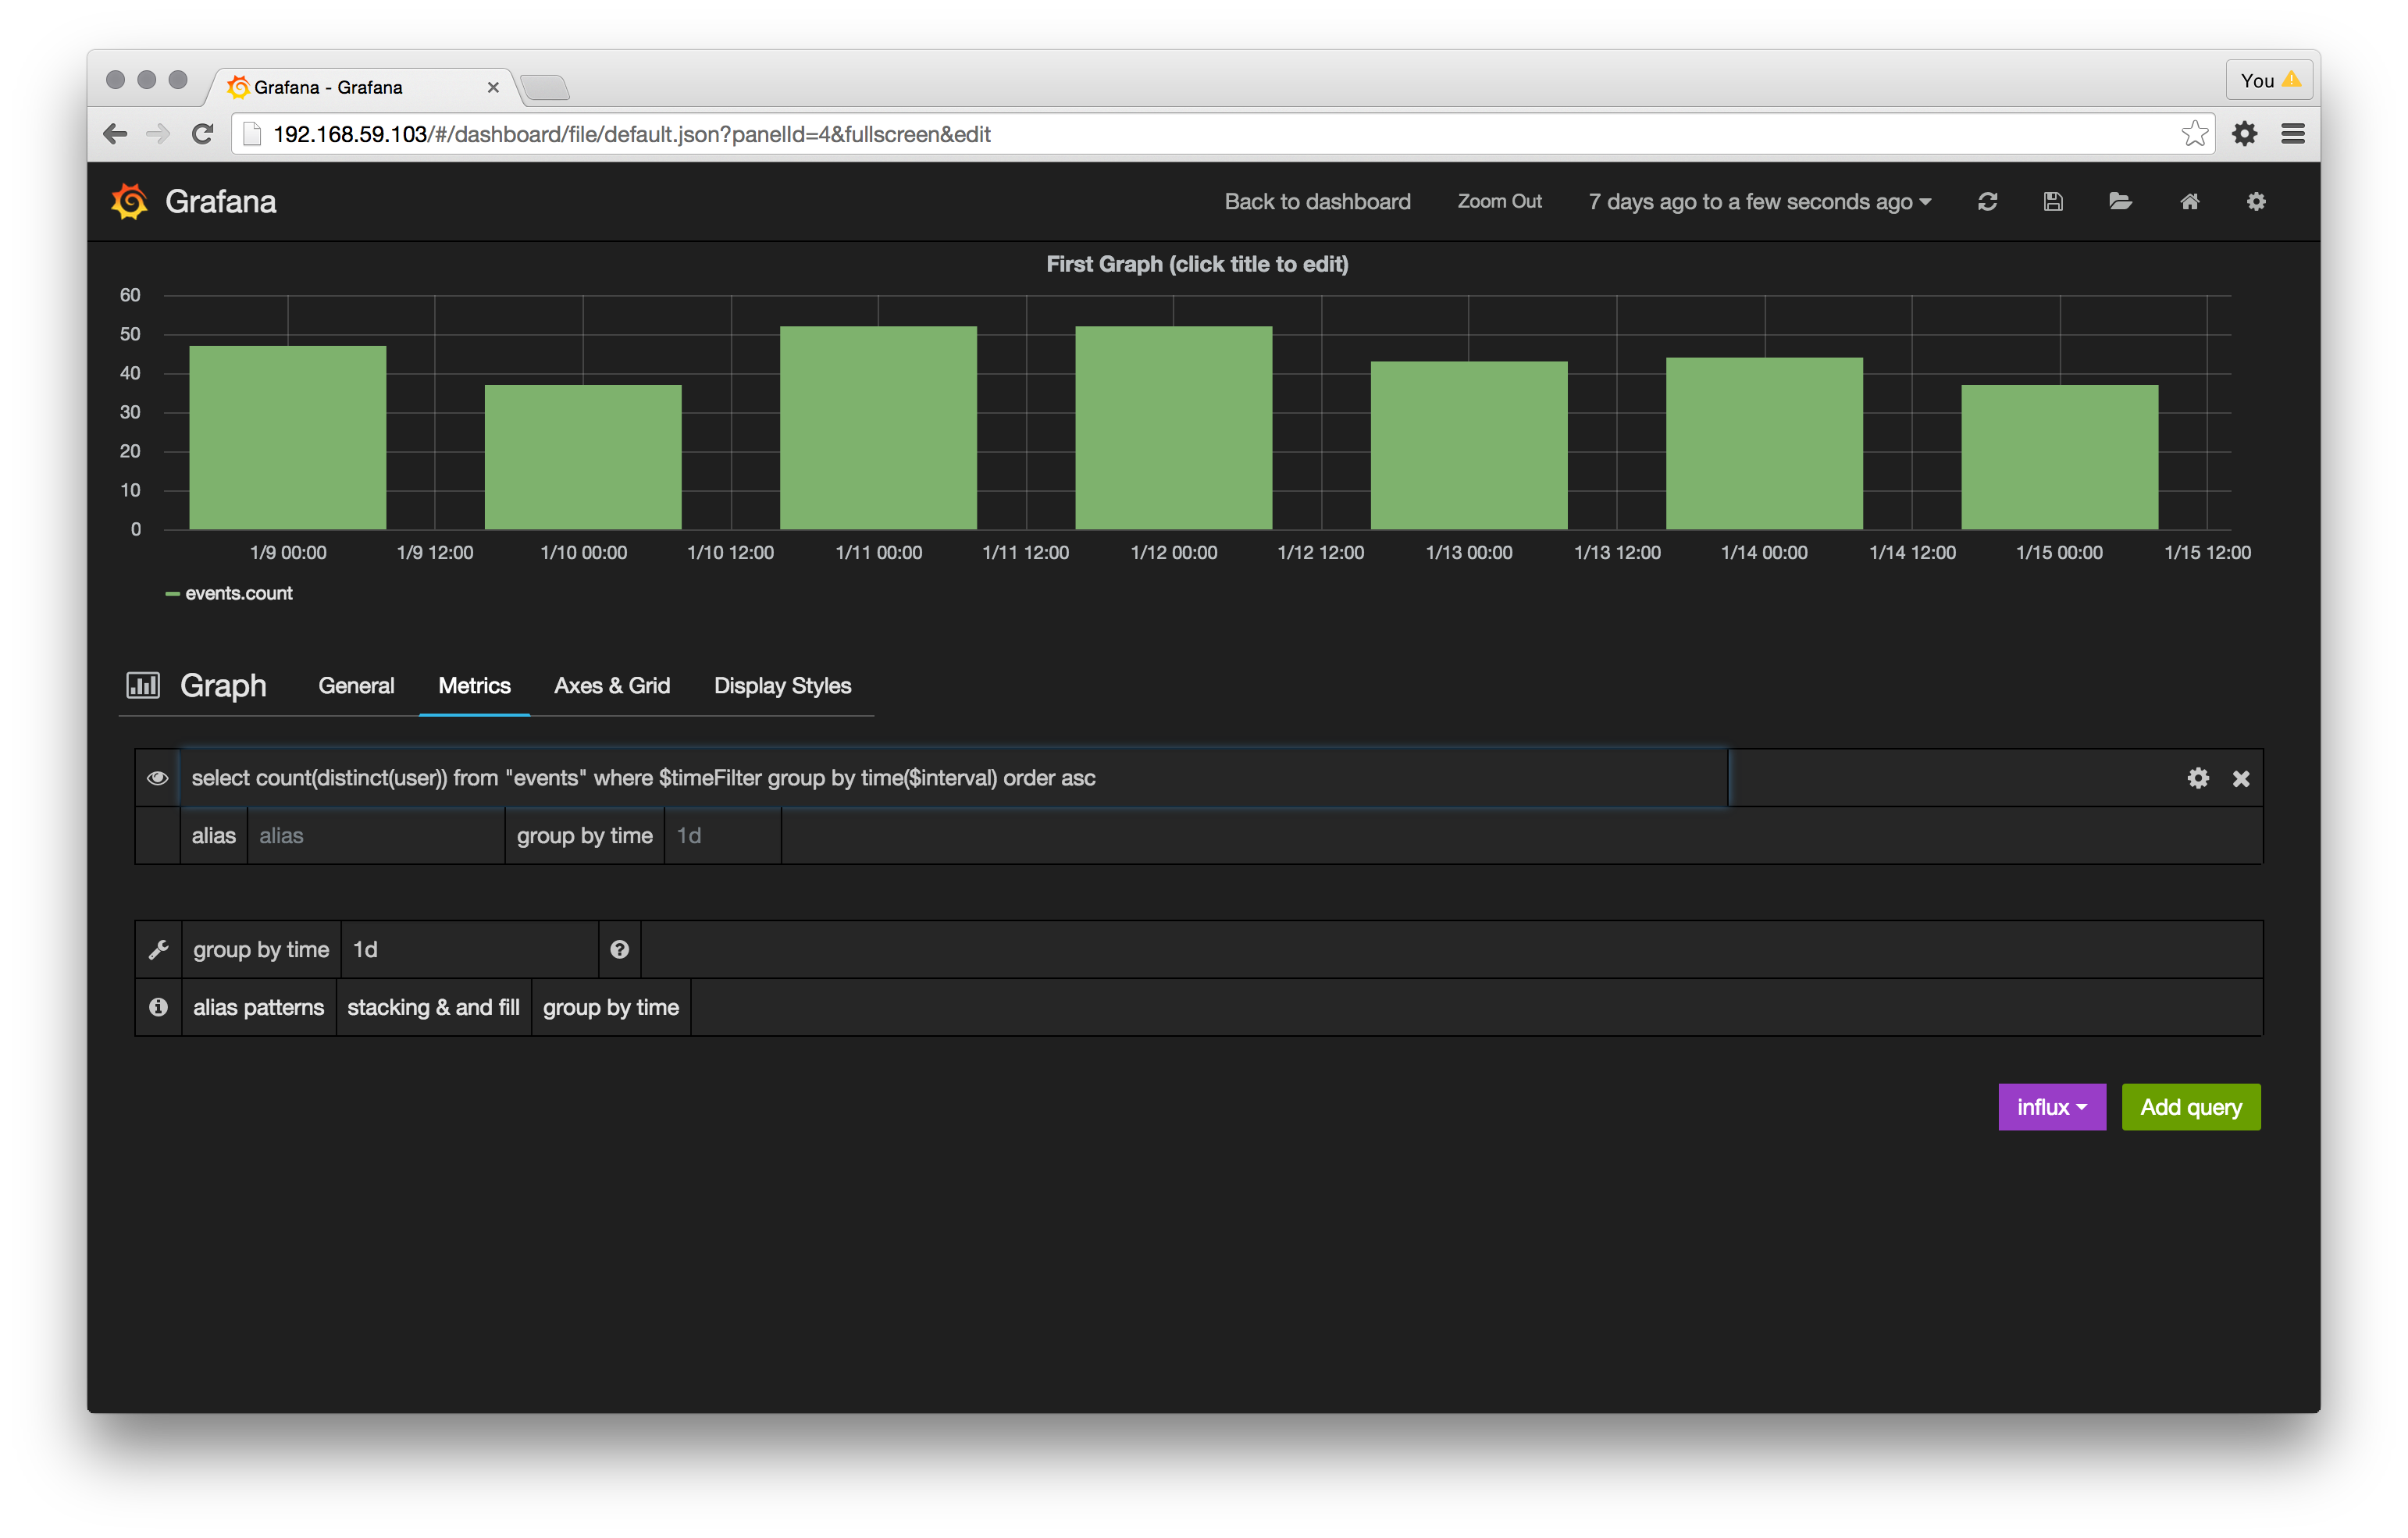
You have just created a MixPanel like view for one of the most critical user events in any SaaS - Distinct User Sign Ups!
What Next?
This scalable general purpose data store and visualization we’ve just built can now easily be deployed from your local machine to AWS, Google or your own Data Center AND scaled up or down as needed.
This means your engineering efforts can be focused on rapidly building and iterating on complex domain specific analytics from the time based data that impact your business rather than wrestling with infrastructure.
The confluence of advances in the core containerization technology and broad ecosystem support makes this an exciting time for anyone whose business depends on software - which these days is all businesses whether your business is in IoT, Healthcare or Retail. We are still in the early days of containerization and I look forward to seeing how the technology will be leveraged by enterprising engineers in the near future to build the next Wal-Mart or Dell and change the way people live.
Edit 1/21 : Fixed links and typos
Edit 1/25 : Updated Grafana container run command to have dashboards written out to InfluxDB via Darren Craine